Select the relevant link below to navigate to a specific desired section or continue reading the full content:
Student Profile data
Our student profile
information shows data relating to students enrolled at Northumbria University
in the 2023/24 academic year. This data includes all full-time students
studying at our Newcastle campus. Numbers have been rounded to the nearest 5
and suppressed when below 5.
The age on entry profile
of our students differs by the level of study and is typical of the sector with
a large number of UG students joining Northumbria straight from sixth
form/college aged 18. By contrast over 53% of our PGT students in 2023/24 were aged
25 and above at the point of entry. 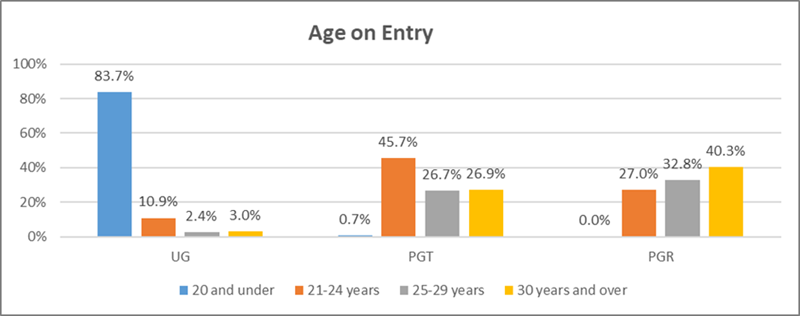
Age Range
|
UG Enrolled
|
PGT Enrolled
|
PGR Enrolled
|
|
20 and under
|
13,905
|
20
|
-
|
|
21-24 years
|
1,805
|
1,475
|
190
|
|
25-29 years
|
400
|
865
|
230
|
|
30 years and over
|
505
|
870
|
285
|
Alt text: The table and chart
show the distribution of full-time Newcastle campus students in 2023/24 split
by study level and age on entry band. At UG level, students aged 20 and under
on entry had a headcount of 13,905 (83.7%), those aged 21-24 years had a
headcount of 1,805 (10.9%), those aged 25-29 years had a headcount of 400 (2.4%),
and those 30 years and over had a headcount of 505 (3.0%). At PGT level,
students aged 20 and under on entry had a headcount of 20 (0.7%), those aged
21-24 years had a headcount of 1,475 (45.7%), those aged 25-29 years had a
headcount of 865 (26.7%), and those 30 years and over had a headcount of 870
(26.9%). At PGR level, students aged 21-24 years on entry had a headcount of
190 (27.0%), those aged 25-29 years had a headcount of 230 (32.8%), and those
30 years and over had a headcount of 285 (40.3%).
We collect detailed
student disability data which includes details of mental health conditions,
learning difficulties, physical impairments and social, behavioural and
communication impairments to ensure we can target our student support most
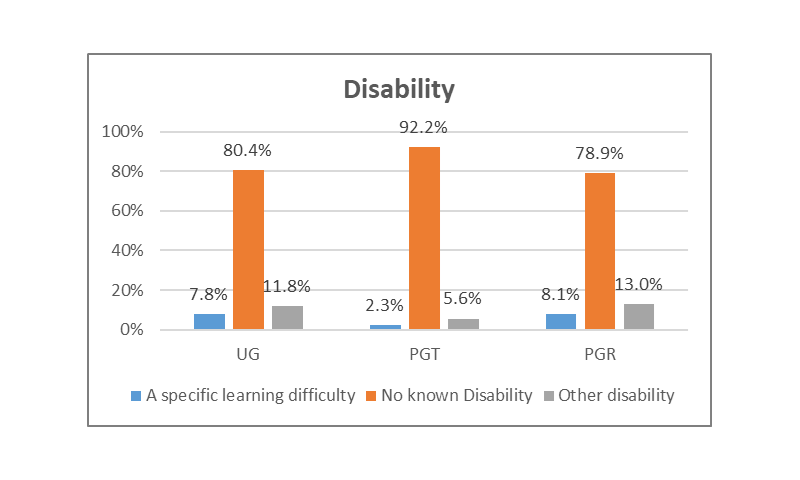
effectively. The aggregate data presented below shows that 19.6% of
Northumbria’s FT UG student body had a known disability in 2023/24. The latest
sector data relates to 2022/23 and shows that the figure across the sector was
18.7% (HEIDI Plus Student FPE 2022/23). Northumbria also has a higher
proportion of students with a known disability at PGT level (7.9% vs 2022/23
sector 7.7%) and at PGR level (21.1% vs 2022/23 sector 15.4%).
Type
|
UG Enrolled
|
PGT Enrolled
|
PGR Enrolled
|
|
No known disability
|
13,360
|
2,980
|
555
|
|
A specific learning difficulty
|
1,295
|
75
|
55
|
|
Other disability
|
1,960
|
180
|
90
|
2. Distribution of full-time Newcastle campus students in 2023/24 split by study level and disability category
Alt text: The table and chart
show the distribution of full-time Newcastle campus students in 2023/24 split
by study level and disability category. At UG level, students with no known
disability had a headcount of 13,360 (80.4%), those with a specific learning
difficulty had a headcount of 1,295 (7.8%) and those with another disability
had a headcount of 1,960 (11.8%). At PGT level, students with no known
disability had a headcount of 2,980 (92.2%), those with a specific learning
difficulty had a headcount of 75 (2.3%) and those with another disability had a
headcount of 180 (5.6%). At PGR level, students with no known disability had a
headcount of 555 (78.9%), those with a specific learning difficulty had a
headcount of 55 (8.1%) and those with another disability had a headcount of 90
(13.0%).
In addition to our
Newcastle Campus, Northumbria has a London Campus and multiple Transnational
Education Partners, overall making up a diverse student body with over 12,000
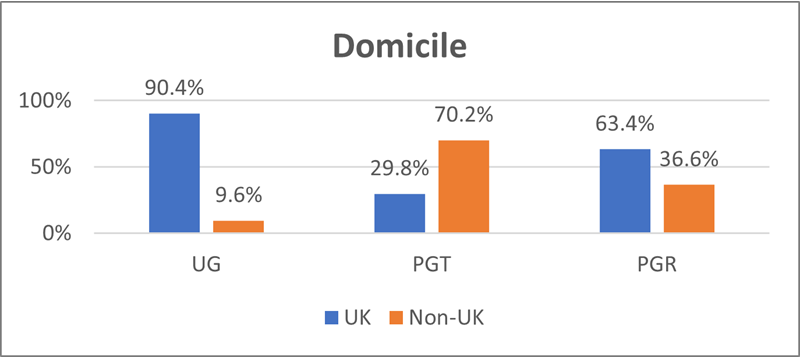
international students from c.145 countries. The table and graph below show the
domicile split for Newcastle Campus. The domicile split between the different
study levels is very different with our large UG cohort including over 90% of
students from the UK. Within this UK cohort, 62% of students come from the
North East of England (HEIDI Plus; Student FPE 2022/23) indicating our strong
regional presence. At PGT and PGR levels, we have a much stronger international
presence with large intakes from countries such as India, Nigeria, Sri Lanka,
Malaysia and Pakistan who made up our 5 largest cohorts from outside the UK at
PGT level.
| |
UG Enrolled
|
PGT Enrolled
|
PGR Enrolled
|
|
UK
|
15,015
|
965
|
445
|
|
Non-UK
|
1,595
|
2,270
|
260
|
Alt text: The table and chart
show the distribution of full-time Newcastle campus students in 2023/24 split
by study level and disability category. At UG level, students with no known
disability had a headcount of 13,360 (80.4%), those with a specific learning
difficulty had a headcount of 1,295 (7.8%) and those with another disability
had a headcount of 1,960 (11.8%). At PGT level, students with no known
disability had a headcount of 2,980 (92.2%), those with a specific learning
difficulty had a headcount of 75 (2.3%) and those with another disability had a
headcount of 180 (5.6%). At PGR level, students with no known disability had a
headcount of 555 (78.9%), those with a specific learning difficulty had a
headcount of 55 (8.1%) and those with another disability had a headcount of 90
(13.0%).
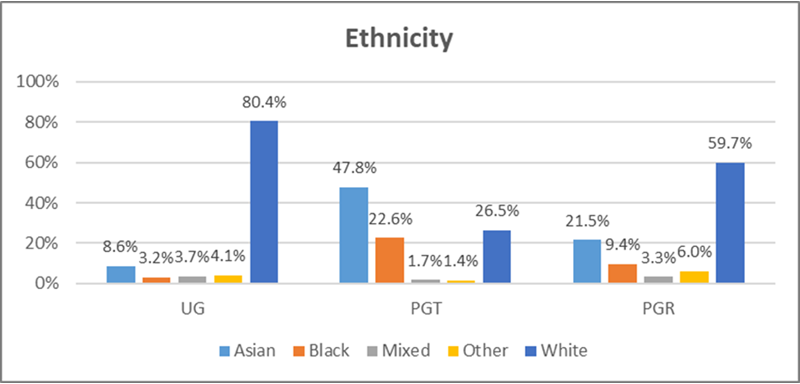
The Ethnicity splits
shown below are shaped by the domicile split described above with higher
proportions of BAME students at PGT and PGR level and the proportions at UG
level in particular are influenced by the North East region’s demographics. For
example, the population of black UK students at Northumbria is small when
compared to the sector but this is due in part to the demographics of the North
East region and the strong regional profile of Northumbria’s UG intake. 3.2% of
FT UK UG students at Northumbria in 2023/24 were black compared to an UK
provider average of 7.1% (HEIDI Plus; Student FPE 2022/23). Official census and
labour market statistics show that only 1.5% of people aged between 16 and 64
in the North East were black in the census period July 2021 to June 2022.
Ethnicity
|
UG Enrolled
|
PGT Enrolled
|
PGR Enrolled
|
|
White
|
13,220
|
845
|
410
|
|
Black
|
520
|
720
|
65
|
|
Asian
|
1,415
|
1,520
|
150
|
|
Other
|
680
|
45
|
40
|
|
Mixed
|
605
|
55
|
25
|
Alt text: The table and chart
show the distribution of full-time Newcastle campus students in 2023/24 split
by study level and ethnicity. At UG level, white students had a headcount of
13,220 (80.4%), black students had a headcount of 520 (3.2%), Asian students
had a headcount of 1,415 (8.6%), mixed ethnicity students had a headcount of
605 (3.7%), and other ethnicity students had a headcount of 680 (4.1%). At PGT
level, white students had a headcount of 845 (26.5%), black students had a
headcount of 720 (22.6%), Asian students had a headcount of 1,520 (47.8%),
mixed ethnicity students had a headcount of 55 (1.7%), and other ethnicity
students had a headcount of 45 (1.4%). At PGR level, white students had a
headcount of 410 (59.7%), black students had a headcount of 65 (9.4%), Asian students
had a headcount of 150 (21.5%), mixed ethnicity students had a headcount of 25
(3.3%), and other ethnicity students had a headcount of 40 (6.0%).
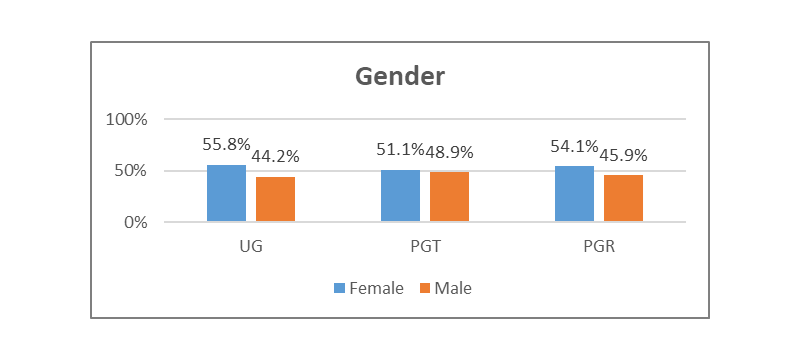
The gender split of the
student population at Northumbria is similar to that of the UK HE sector with
55.8% of our full-time UG students in 2023/24 being female compared to 56.3% in
the sector (HEIDI Plus Student FPE 2022/23). At PGT level, there is some
variation with females making up 51.1% of the student population compared to
54.9% across the sector.
Gender
|
UG Enrolled
|
PGT Enrolled
|
PGR Enrolled
|
|
Male
|
7,340
|
1,580
|
320
|
|
Female
|
9,265
|
1,650
|
380
|
|
Other
|
10
|
-
|
5
|
Alt text: The table and chart
shows the distribution of full-time Newcastle campus students in 2023/24 split
by study level and gender. At UG level, female students had a headcount of
9,265 (55.8%) and male students had a headcount of 7,340 (44.2%). At PGT level,
female students had a headcount of 1,650 (51.1%) and male students had a
headcount of 1,580 (48.9%). At PGR level, female students had a headcount of
380 (54.1%) and male students had a headcount of 320 (45.9%).
Northumbria is proud to
be a successful Widening Participation (WP) Institution, with a high proportion
of students coming from widening participation backgrounds. In semester one
2024/25, 69.4% of eligible students completed our diversity monitoring enrolment
form. Of those who completed the form, 88.6% (20,125) self-identified as
belonging to one or more WP groups (including those who identify as Black,
Asian or Minority Ethnic, Care Leaver, Commuter Student, Disabled, Estranged,
First-Generation, Eligible for Free School Meals, Gypsy, Roma and Traveller
Communities, LGBTQ+, Low Participation Neighbourhoods, Mature Student, Military
Background, Sanctuary Scholar or Young Carer).
Diversity Monitoring
data is used as a starting point for further, meaningful conversations with
staff and students. This data is used to provide new insights and monitor and
evaluate our activity, rather than to put students into boxes. Data is disaggregated
as much as possible, and we acknowledge that intersectionality and individual
student experiences are important considerations. However, there are benefits
for core business in collecting diversity data which include attracting buy in
to work. We have introduced a Diversity Monitoring Dashboard to allow key
stakeholders to view data in an informative and user-friendly way.
We continually analyse
and evaluate student performance through an EDI lens on metrics across the
student lifecycle including Access rates, Continuation (the proportion of new
entrants who remain in HE one year after enrolment), Completion (the proportion
of new entrants who go on to complete their qualification) and Progression (the
proportion of graduates who go into skilled employment or further study).
A key part of this work is identifying areas
where there are gaps in performance and setting targets to close gaps with
appropriate interventions put in place to enable the closing of the gaps. This
work is captured as part of the University’s Access and Participation Plan
which was approved by the Office for Students in October 2023 and covers the
period 2024/25 to 2027/28.


